METAGRAPH: (un)directed graphs with METAPOST
Introduction
METAGRAPH is a small set of macros that help in drawing (un)directed graphs with METAPOST and the boxes package. The basic idea is providing low-impact definitions that produce automatically (labelled) nodes/vertices and (labelled) edges/arcs that connect correctly boxed items. Moreover, circular boxes with fixed radius are made available to produce more aesthetically pleasant graphs.
Usage
Just include metagraph.mp in your source files. Full documentation is provided with the package.
Examples
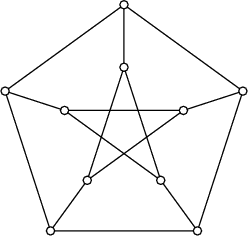
% Petersen's graph
noderadius := 2;

for i = 0 upto 4:
  node.x[i]; node.y[i];
  x[i].c = up scaled 60 rotated (360i/5);
  y[i].c = up scaled 30 rotated (360i/5);
endfor;

for i = 0 upto 4: drawboxed(x[i],y[i]); endfor;

for i = 0 upto 4:
  draw arc(x[i])(--)(x[(i+1)mod 5]);
  draw arc(y[i])(--)(y[(i+2)mod 5]);
  draw arc(x[i])(--)(y[i]);
endfor;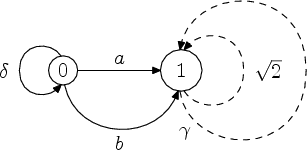
% A bells-and-whistles example
prologues := 2;
noderadius := 7; node.x0("0"); noderadius := 10; node.x1("1");
x1c = x0c + (2cm,0);
drawboxed(x0, x1);
drawarrow larc(x0)(--)(x1)(btex $a$ etex);
drawarrow larc.bot(x0)({down}..)(x1)(btex $b$ etex);
drawarrow lloop(x0, left, btex $\delta$ etex);
drawarrow lloop(x1, right, btex $\sqrt2$ etex) dashed evenly;
drawarrow lloop.llft(x1, 2right, btex $\gamma$ etex) dashed evenly;
The logo
To be able to write METAGRAPH using the METAFONT logo font, a few new letters had to be created. We hope Don Knuth and John Hobby forgive us:
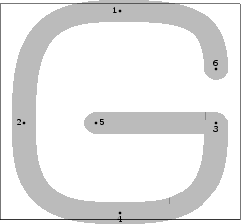
beginlogochar("G",15);
x1=x4=.5w; top y1=h+o; bot y4=-o;
x2=w-x3=good.x(1.5u+s); y2=y3=y5=barheight;
x5=x3-.5w; draw z3--z5;
x6=x3; y6=y3+h/4;
%x5=.5[w-leftstemloc,lft w]; x6=x5-.5w; y6=y5=barheight;
super_half(2,1,6); super_half(2,4,3);
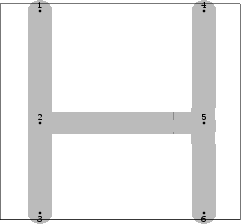
labels(1,2,3,4,5,6); endchar;beginlogochar("H",15);
x1=x2=x3=leftstemloc;
x4=x5=x6=w-x1+ho;
top y1=top y4=h+o;
y2=y5=barheight;
bot y3=bot y6=-o;
draw z1--z3; draw z4--z6; draw z2--z5;
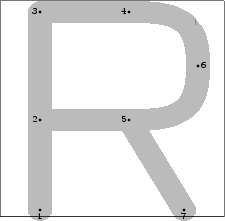
labels(1,2,3,4,5,6); endchar;beginlogochar("R",14);
x1=x2=x3=leftstemloc;
x4=x5=.618[x1,w-x1];
x7=w-x2; y1=y7;
y2=y5; y3=y4; bot y1=-o;
top y3=h; y2=barheight;
draw z1--z3--z4; draw z2--z5; draw z5--z7;
x6=.5[w-x1,lft w]; y6=.5[y4,y5];
super_crescent(4,6,5);
labels(1,2,3,4,5,6,7); endchar;